Colorimetric method
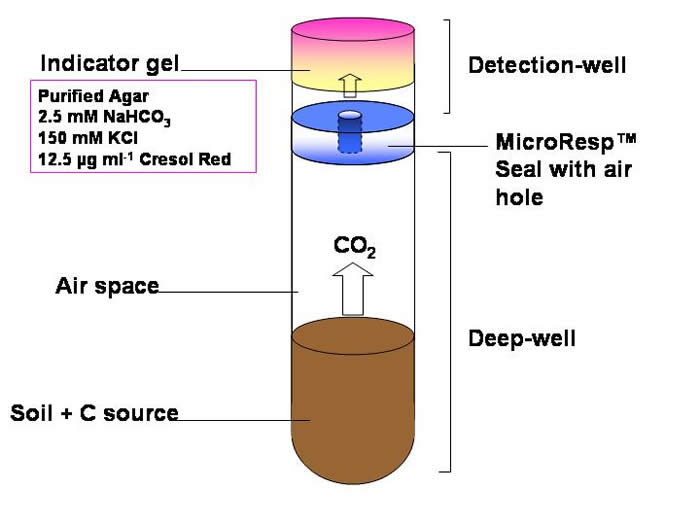 The use of an indicator dye that changes colour with the change in pH when CO2 reacts with bicarbonate. Shown in the equation:
CO2 (gas) + H2O + HCO3-↔ 2CO3 2- + 3H+
The cresol red changes from pink to yellow as the pH decreases. KCl is present to reduce the effect of ionic strength on pH.
Reference: Rowell, M.J. 1995. Colorimetric Method for CO2 Measurement in Soils. Soil Biology & Biochemistry, 27(3), 373-375.
Radioactive Carbon (14C) method
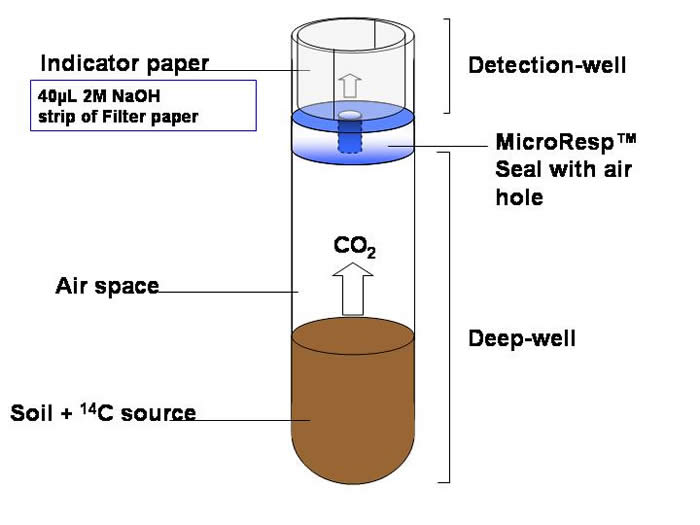
The filter (indicator) paper sits around the edge of each well and the 2M NaOH, that is absorbed by the filter paper, traps the 14CO2 that is released from the soil.
After incubation the detection plate is removed and scintillation fluid added to the wells. The radioactivity is determined using a microplate liquid scintillation counter.